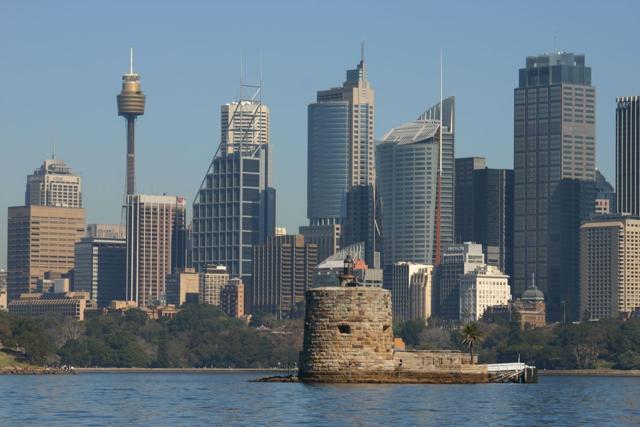
Fort Denison’s round stone tower makes an unmistakable foreground to Sydney’s skyline in Takver’s 2005 photograph. Yet some of the island’s useful hardware was much less conspicuous. A tide-station record prepared in January 2017 lists two brass pins in the top of its sandstone parapet, one at each end. They were survey benchmarks: the fort’s masonry helped give a water-level reading a reference on land. [1, 3]
A number on a gauge needs somewhere to start. The Bureau of Meteorology describes a tidal benchmark as a fixed mark near a station against which its measurements can be referenced. That is a different task from watching the water itself. The pins did not sense the tide; they helped establish the heights used to measure it. [3]
Where is this place?
Fort Denison, Sydney Harbour, New South Wales — historical site context, not an access or navigation guide. This map locates the town or region, not a verified exact historic event site.
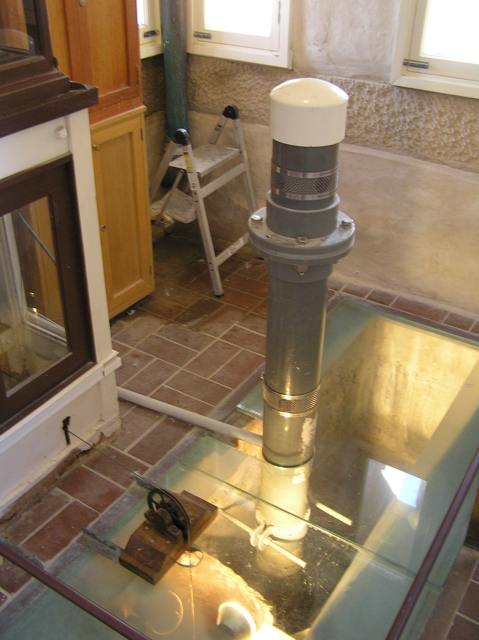
The 2017 record describes a radar sensor brought into service on 3 November 2016, mounted on an existing tube over a stilling well inside the tide room. Its calibration was not simply a matter of switching it on. On 16 November, sensor readings and readings from a separate tide staff were recorded every fifteen minutes over sixteen hours, spanning a full tidal cycle. Heights were also checked by differential levelling. [1]
The well supplied another kind of restraint. In the Bureau’s glossary, a stilling well communicates with the sea through a small opening, filtering short-period waves while admitting slower changes in water level. The apparatus had to make the harbour legible without treating every passing ripple as the whole story. [3]
Length of service requires similar care. A 2008 study by the New South Wales Department of Environment and Climate Change dates the first entry in Fort Denison’s Tide Register to 11 May 1866. But it distinguishes that early start from the reliable continuous record beginning in 1914, citing errors in the earlier observations. An old starting date and an equally trustworthy series are not the same achievement. [2]
Nor does a local gauge measure only astronomical tides. The study explains that the record also includes weather, oceanographic and harbour effects. Over longer periods, a reading relative to land must also be distinguished from changes in the sea alone: the land can move. The benchmark is a reference to be understood, not a promise that the world around it is motionless. [2]
The two photographs here are dated 2005 and 2011; neither shows the 2016 calibration. The station document, too, is a dated account, not confirmation of today’s equipment. Together, they point to a less monumental way of reading this monumental place: a fort can preserve a view, while small marks in its stonework help preserve the meaning of a measurement.