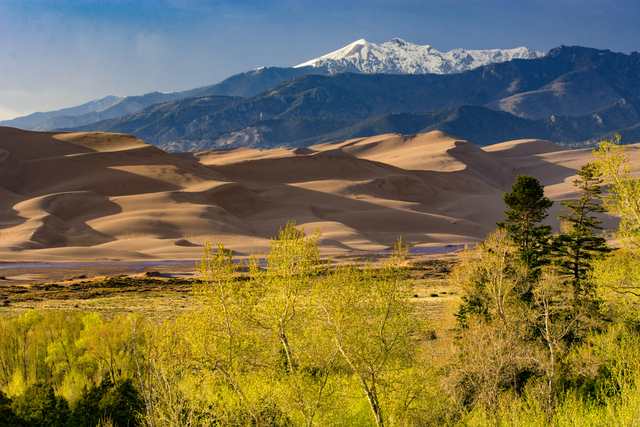
To anticipate Medano Creek’s flow, researchers started with a weather station on Medano Pass. Climate readings from the mountains helped them calculate water entering the stream from rain and melting snow, before it travelled down towards Colorado’s Great Sand Dunes. [1]
The method followed water through several stages. Snow could store it; soil could hold it; runoff could carry it into streams. Evaporation and plants returned some to the air. Keeping those movements in the calculation gave the researchers more information than temperature and rainfall totals alone. [1]
Where is this place?
Medano Creek, Great Sand Dunes National Park and Preserve, Colorado. This map locates the town or region, not a verified exact historic event site.
David Thoma and colleagues published their case studies in 2020. In a subsequent National Park Service account, Sonya Daw, Thoma and Billy Schweiger reported that the model had predicted Medano Creek’s flow reasonably well as much as 46 days ahead. They identified possible uses beyond planning a day by the dunes: anticipating low flows could also help with irrigation, water-rights management and the needs of native Rio Grande cutthroat trout. [1]
Down on the sand, the creek has a much shorter rhythm. Fast water crossing a smooth, shifting bed builds small underwater sand dams, called antidunes. Water accumulates until a dam breaks and releases a pulse downstream. The park describes waves arriving roughly every 20 seconds when conditions produce this surge flow. These repeated waves are a different timescale from the research model’s weeks-ahead forecast. [2]
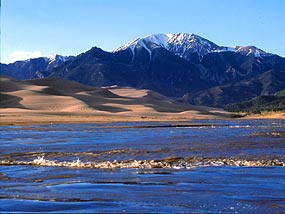
Even the park’s public flow graph needs a location attached to it. Its readings come from where Medano Creek first reaches the sand, about five miles upstream of the main dunes parking area. The park uses that number to show whether flow is rising or falling, not as a measurement of the water beside the parking lot. [3]