ELE4 was a GPS station on the ice inside Mount St Helens. Helicopters deployed instruments designed for volcano monitoring. Availability for glacier work was intermittent. ELE4 supplied the longest movement record—and caught the period when the glacier’s sideways squeezing eased and stopped. [1]
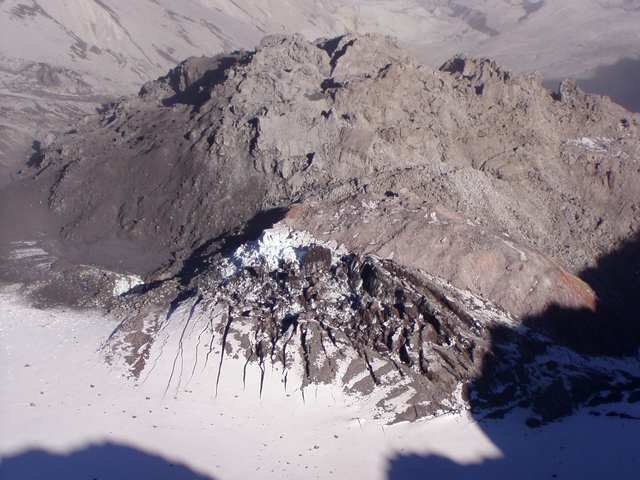
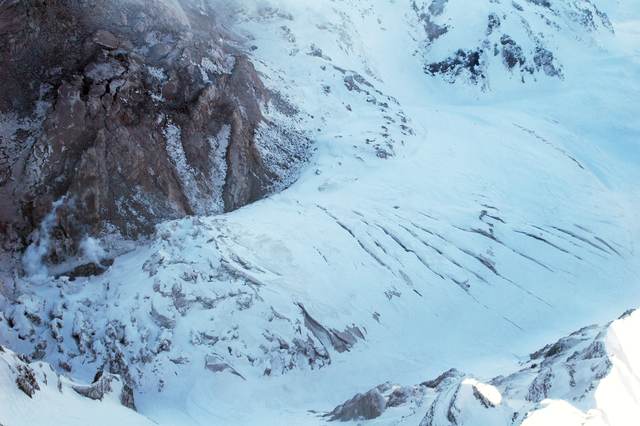
The photographs make the cramped setting visible. In Michael Poland’s October 2, 2004 view, fractured, snow-covered ice rises beneath the old lava dome. A second USGS image, catalogued January 14, 2005, looks across deeply crevassed ice beside a steep rock face. They are different views, not a matched before-and-after measurement.
Where is this place?
Crater Glacier, Mount St Helens, Washington. This map locates the town or region, not a verified exact historic event site.
Mount St Helens had reawakened in September 2004. After an opening series of steam-and-ash explosions, a less explosive process began changing the crater’s interior. On October 11, solid but hot lava spines broke through the deformed glacier. Much of this lava had already solidified underground; it emerged as rock that could shove its surroundings, rather than simply spreading as a molten flow. [2]
The new dome divided Crater Glacier into two arms and forced ice northward. The older dome remained there too. In the USGS account of the 2004–2008 eruption, the glacier had little influence on the growing spines; the spines profoundly rearranged the glacier. [2]
Stephen F. Price and Joseph S. Walder’s 2007 study examined the eastern arm. Squeezed between the expanding dome and crater wall for nearly six months, it thickened almost twofold in places and sped up. As the squeeze diminished, movement slowed and ice shifted downstream. This was local deformation, not a doubling of the glacier’s total ice supply. [1]
Their two-dimensional model helped explain why the thickened ice did not simply race away. The lower, unsqueezed reach and a narrow passage resisted its flow. The researchers compared calculations with surface measurements, including ELE4’s changing speed, while acknowledging that their simplified geometry missed some three-dimensional effects. [1]
ELE4’s useful record included the slowdown: the glacier relaxing after the rock beside it stopped pressing so hard. [1]